Check out the code for this project here
Building a Pivot Point Trading Bot with Python and Alpaca
To introduce myself to trading with technical analysis I decided to try and implement a simple pivot point trading strategy in python using the Alpaca API. I have only been paper trading with this as this was purely a learning exercise rather than something to make money with. However, this has taught me some of the basics in finance and allowed me to further develop my python programming skills
One of the great advantages of automated trading is that you can just sit back and let it do its thing. This takes the emotional aspect out of trading and means you are less prone to make silly decisions based on emotion. This is something that amature traders and investors often do which is why I wanted to start with an algorithmic approach to avoid building this bad habit.
The Strategy
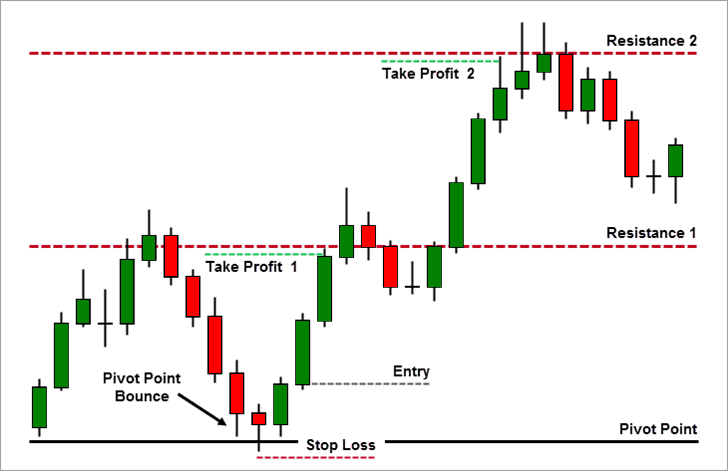
In technical analysis pivot points are called leading indicators. This means they are using to project the potential support and resistance for the current day. This is different from an indicator like a moving average which is a lagging indicator meaning it tells you what has already happened.
 (credit)
First, the program calculates the primary Pivot Point () using the previous trading day's high, low, and closing prices:
After that it calculates the first levels of Support () and Resistance ():
This program looks at the minute bars. If the previous minute bar closes below the support line but the latest one closes above it the program thinks this is a bounce up and it buys the shares. On the other hand, if the price drops below the resistance level the bot sells the share to take a profit.
The Tech stack
To build this I used python pandas to analyse and manipulate the data as this is the industry standard and is something that I am familiar with. I used alpaca api to obtain the stock price data as they have a good paper trading option and have a good documentation. I also used marketwatch to obtain a list of stocks with a price between 0 and 1 dollars as I wanted to experiment with this program on low prices to see if it performed differently to high prices.
What's Next?
If I were to actually bring this to production and use real money instead of just paper trading there are a few of things that I would change and add:
-
Change to WebSockets: At the moment the script is just continuously checking the minute bars. To reduce the latency and the number of API calls I am using I should switch to Alpacas WebSocket stream for real time updates.
-
Historical back testing: As well as testing the bot on live paper trading for a while I would also test it on a large historical backtest to make sure that it works and really ensure it doesn't lose money.
-
Other indicators: I would likely make the program consider other technical analysis indicators when buying the stock. As only relying on pivot points is quite risky and means the bot is more prone to make bad decisions. I would likely include the RSI(relative strength index) indicator as well as potentially some others.