Check out the code for this project here
Building a PyTorch Stock Classifier
In this project I did something slightly different to by previous financial machine learning projects. Instead of trying to product the raw stock price I tried to predict wether the stock price would go higher, lower or flat. This reduces the complexity the model has to learn and has lead to some better results. This was a fun and interesting project that helped me to further develop my knowledge of AI and quantitative finance.
Here I also decided to use PyTorch again and I have gained familiarity for it throughout my other projects. For the API to gain the stock data I also decided to use Alpaca again as I have familiarity with it through my other projects and it is easy to use and I wanted to focus on the AI aspect of this project.
Kinds of classification and loss
I tried two different kinds of classification methods:
-
Binary Classification: Here I mapped the price going up or staying the same to an output of
1and the price going down to an output of0. -
Multi-Class Classification: I also tried sepearting out the flat case from the up case where I used these three cases to classify and up-day, a down-day and a flat day respectively:
[1,0,0],[0,1,0]and[0,0,1].
For the binary classification case I used the Binary Cross-Entropy (BCE) loss function to optimise the model:
For the multi-class classification I used a regular Cross-Entropy Loss function to handle the three distinct categories.
Regression model vs GRU strcutre
1. Regression model
-
As the input we take a rolling 100 day window of historical data
-
I then have 3 linear layers of size 50. Then I also had some 50% dropout layers to prevent overfitting of the data.
-
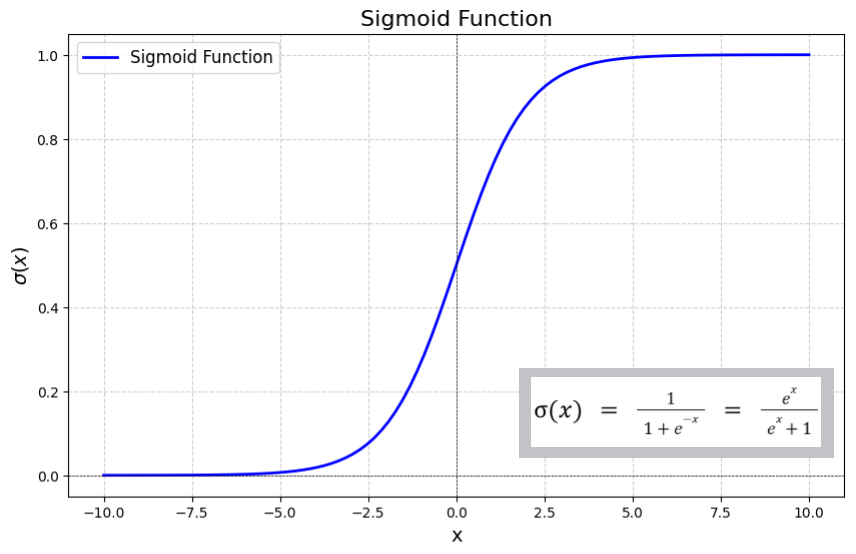
Then on the final output I have a single neuron with a Sigmoid activation function to squash the output into a probability between 0 and 1.
2. GRU (Gated Recurrent Unit)
-
Ive used 3 recurrent layers with a size of 50.
-
Unlike standard feed-foward networks GRUs work by holding a hidden state which holds the memory across the sequence. This means it can contextualise the whole price data and make more informed decisions.
-
The output of the final GRU step is pushed through a linear layer and a Sigmoid activation to generate our directional prediction.
Unbiasing the data
Generally historical finance data formatted in this way is biased towards to "Up" days as stocks go generally increase in price over time.
To unbias this data and prevent training the neural network from just prediction "Up" all the time. I used PyTorch's WeightedRandomSampler to assign weights to the data that appears less frequently.
What's Next?
Here is what I would add if I were to do this project again.:
-
Consensus protocol: I would create a system where it would unify the output from the GRU and the regression model. So it would only execute a trade if both models agree on the output.
-
Giving technical indicators: I would also try feeding in various technical indicators to give the model more indicators like RSI.